While performing analysis of AWS environments and attempting to identify attack paths and lateral movement opportunity, I kept wishing for something akin to BloodHound. Running tools like ScoutSuite and Pacu gets you data. Those tools are indespensible and absolutely should be used, but that data wasn’t enough for me. I wanted to look at an AWS environment similarly to the way I look at an internal pentest.
Enter aws-visualizer, a web-based interactive graph that renders your entire AWS environment from a collected inventory. It maps VPC reachability, services, security group flows, service dependencies, and IAM relationships as nodes and edges, with built-in IAM privilege escalation path analysis powered by DataDog’s pathfinding.cloud.
Why Existing Tools Weren’t Enough
Tools like Reversec/awspx exist, but I kept running into the same problem. They didn’t fit the workflow I actually needed. I wanted something that combined IAM analysis and graph-based visualization in one place.
Before creating this, I was tracking resources through notes. Or worse, I was keeping track of things in my head. Making a mental model of VPC structures was a nightmare. Attack paths would become fuzzy in my mind. And to top things off, AWS resource names are often long, similar-looking, and meaningless at a glance, which made that approach miserable at any scale.
You still need to do some manual analysis to understand and execute more complex attack chains. This doesn’t change that, but it does allow you to visualize the relationships between resources, and that was my personal pain point.
How aws-visualizer Works
There are two components: an ingestor and a visualizer.
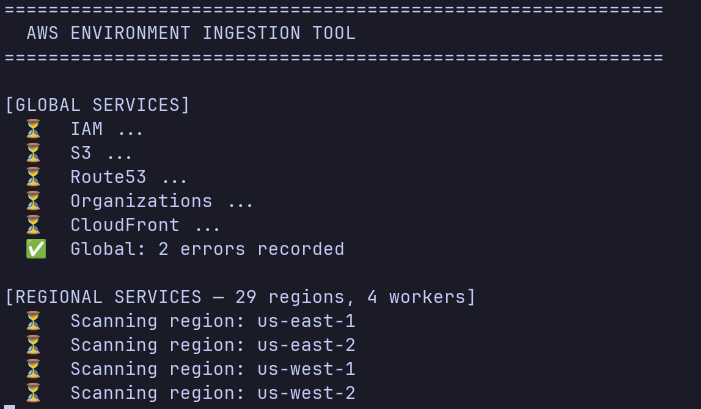
aws_ingest.py attempts to call AWS APIs across your configured regions to collect resources such as EC2 instances, VPCs, subnets, security groups, IAM ucomponents, Lambda functions, and more. It writes everything to a single inventory JSON file that the visualizer can consume.
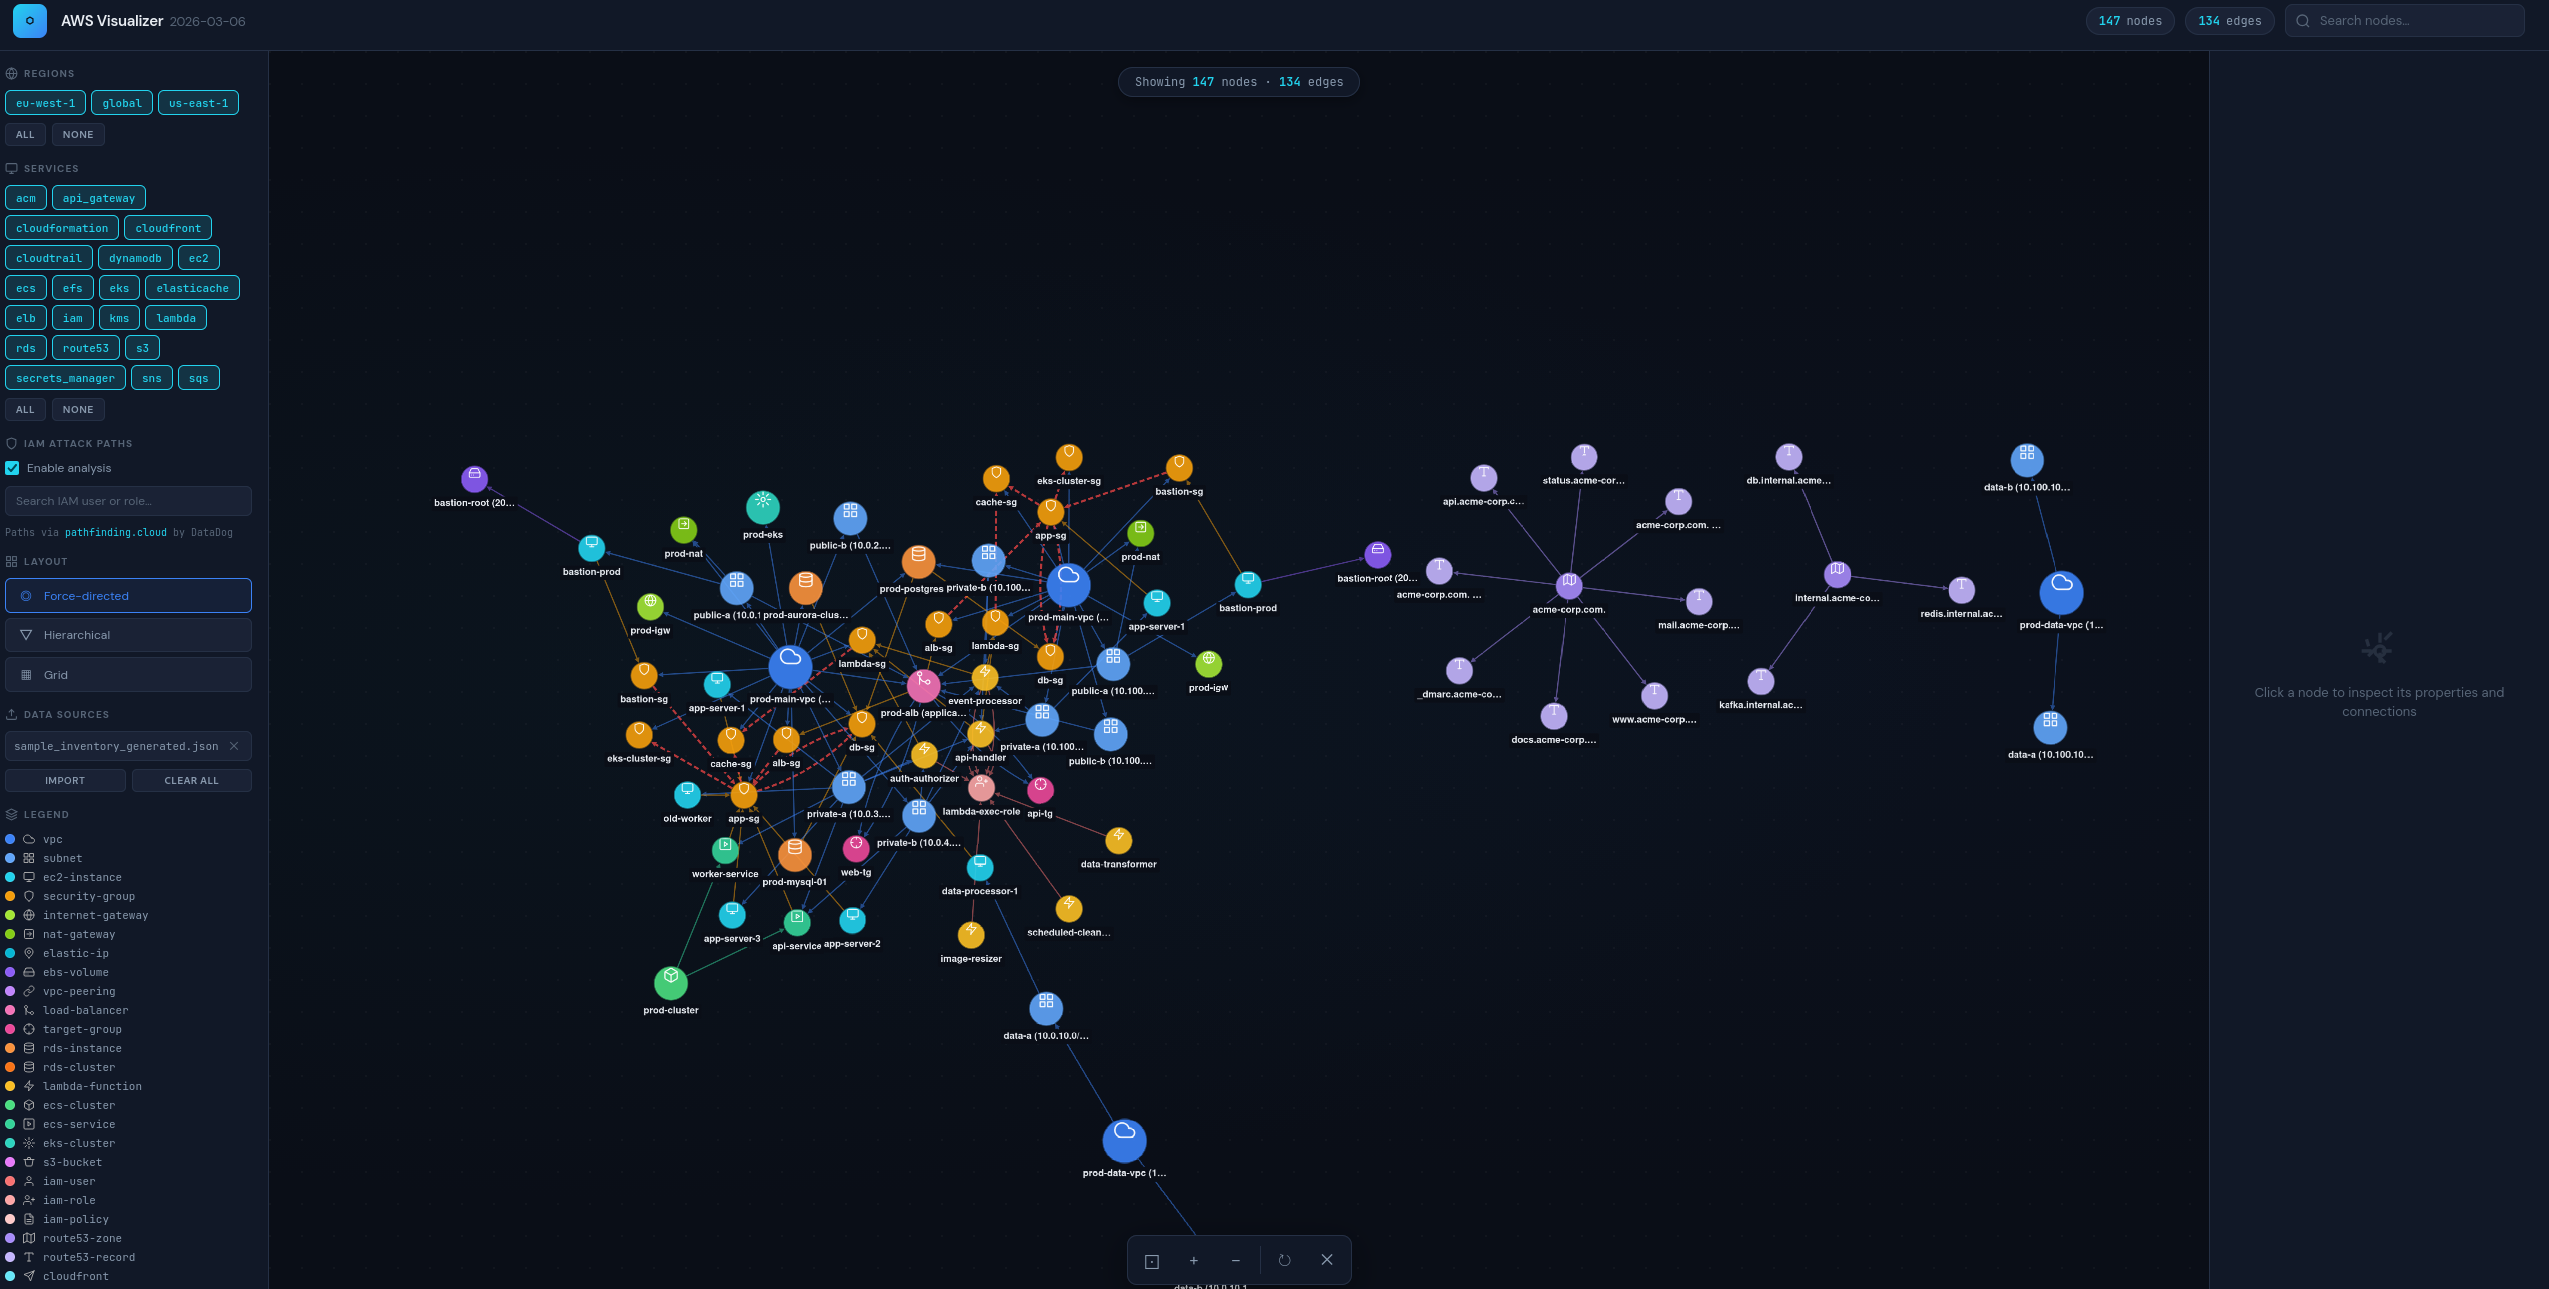
aws_visualizer.py spins up a local Flask server and allows you to select an inventory JSON to load into a Cytoscape.js graph. Each AWS resource becomes a node. Edges represent relationships: VPC containment, security group membership, SG-to-SG traffic rules, IAM role associations, and so on.
Setup
If you have read access to an environment, you can ingest data. If not, I have created a sample generation script for you to test the tool out.
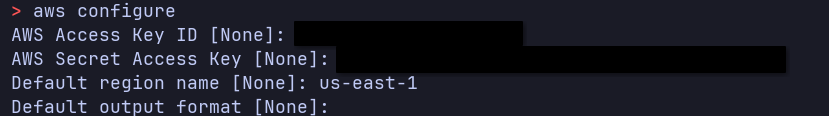
aws configure --profile aws-reader-profile
pip install -r requirements.txt

python3 ingestor/aws_ingest.py --profile aws-reader-profile --output aws_inventory.json
# OR
python3 generate_sample.py --seed N
Analyzing an Environment
python3 visualizer/aws_visualizer.py
This will launch a Flask server at http://localhost:8080. Open it in a browser and you’ll see nothing loaded. In case your environment is huge, I’ve allowed you to select specific regions and services to view. Or, if you do want everything, you can click all. You can also use the search bar to jump to a specific resource by name or ID.
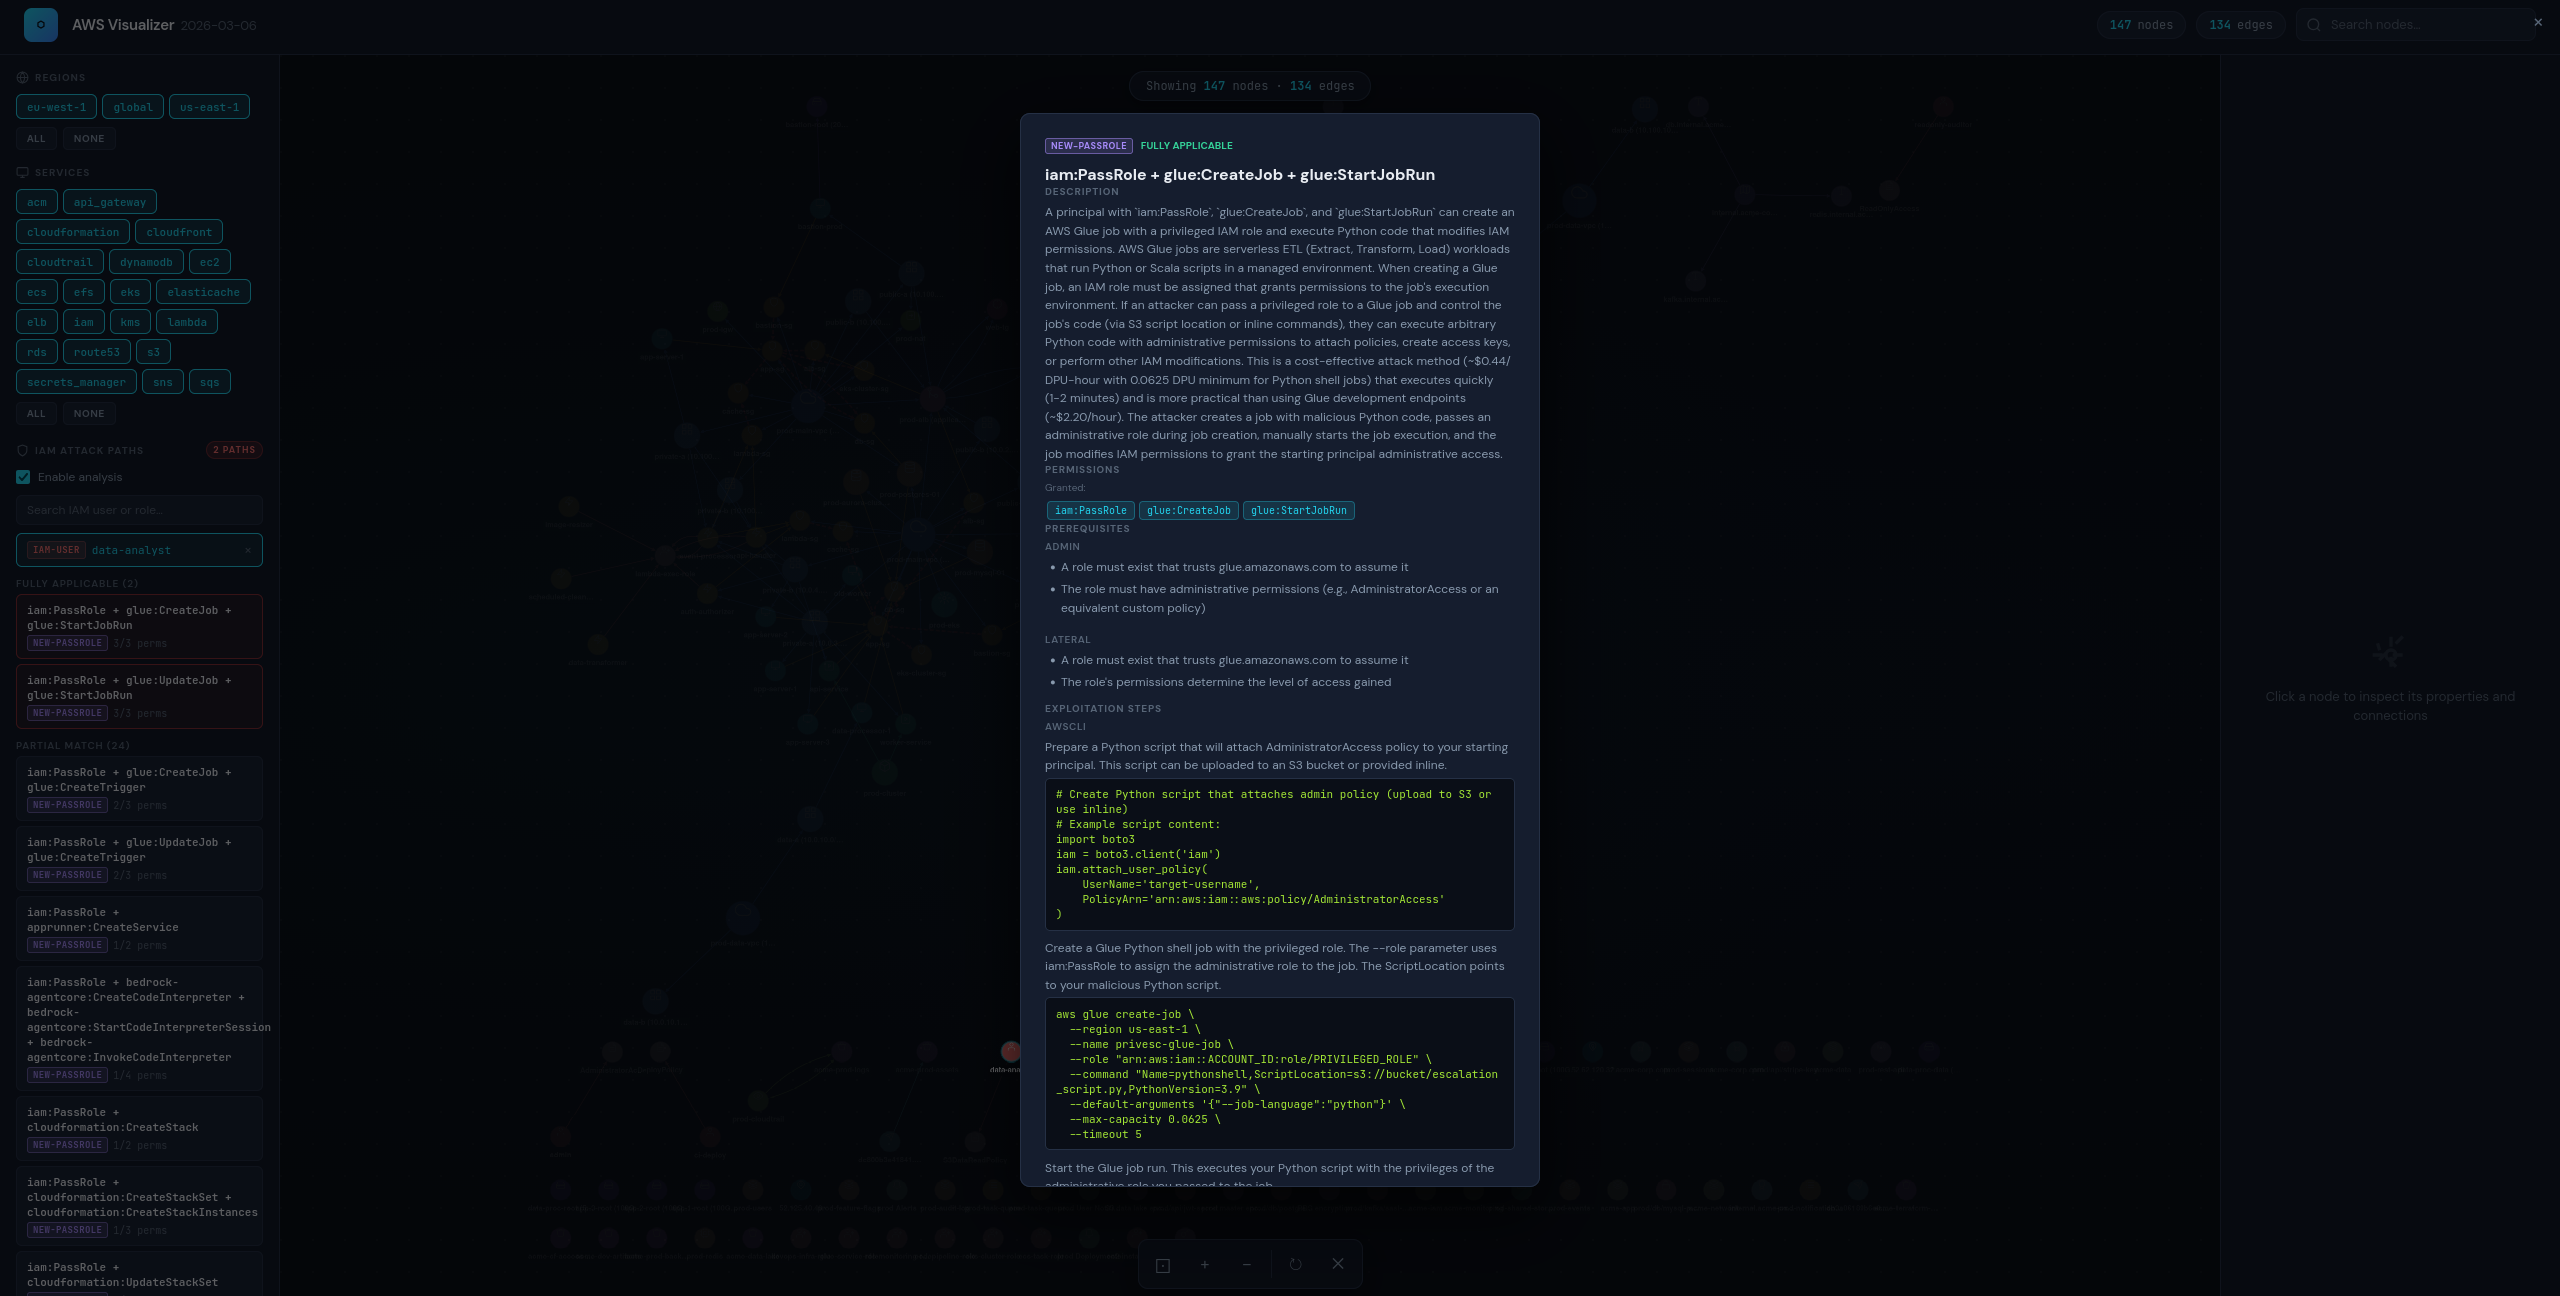
You can also enable (default) or disable the IAM Attack Paths toggle in the left sidebar and click any IAM user or role node. The analyzer reads the object’s permissions: inline policies, attached customer-managed policies, and known AWS managed policies and matches them against escalation path defined in DataDog’s pathfinding.cloud.
Limitations
The IAM analysis doesn’t currently account for SCPs, permission boundaries, or resource-based policies. Those can all restrict what a permission actually allows in practice, so a “fully applicable” path may still be blocked at the org or resource level. It also only models the resources supported by the ingestor, so anything not explicitly enumerated won’t appear in the graph.
Closing Thoughts
Cloud environments are difficult to analyze. I’ve created this tool to help others who have had similar frustrations with trying to visualize attack paths in AWS. This tool is not meant to replace manual analysis, but to complement it. If you have ideas to contribute, feel free to open a pull request.